The Dark Store Index
Quick-commerce platforms don't have one shelf. They have hundreds — one per dark store, each with its own assortment, its own ranking and its own advertisers. Almost nothing published about this market accounts for that. We read individual dark stores, one at a time, and publish what is actually on them.
Every number here is counted from the public shelf a shopper sees, on a stated date, in a named dark store. Nothing is modelled, estimated, projected, or supplied by a brand. Where a measurement has a limitation, we say so on the page rather than in a footnote — including when it means a finding is weaker than it first looked.
What's on this site
Three kinds of thing get published here. If you've arrived from a link and want the shape of it quickly, start below — or go straight to the full archive.
Findings
Original measurement, published when the data shows something new. Currently: a two-city read across 486 dark stores — including a finding of ours that a second city disproved.
When our finding broke →
Blinkit vs Zepto →
Who's buying the Blinkit shelf →
Category reports
Per-category reads with per-store tables across Blinkit, Zepto and Instamart. Each states its date, city and store count.
Platform guides
Registration, listing, seller panels and advertising on each of the three platforms — written from the measured data, not the platform's documentation.
Brand & ad analytics
Where any brand ranks, whether it's in stock, and who owns the sponsored slots — read dark store by dark store, by platform.
Also here: the field guide to how quick commerce works · a glossary of the terms · the method, its limits and who writes this.
The current finding: platform behaviour is city-specific
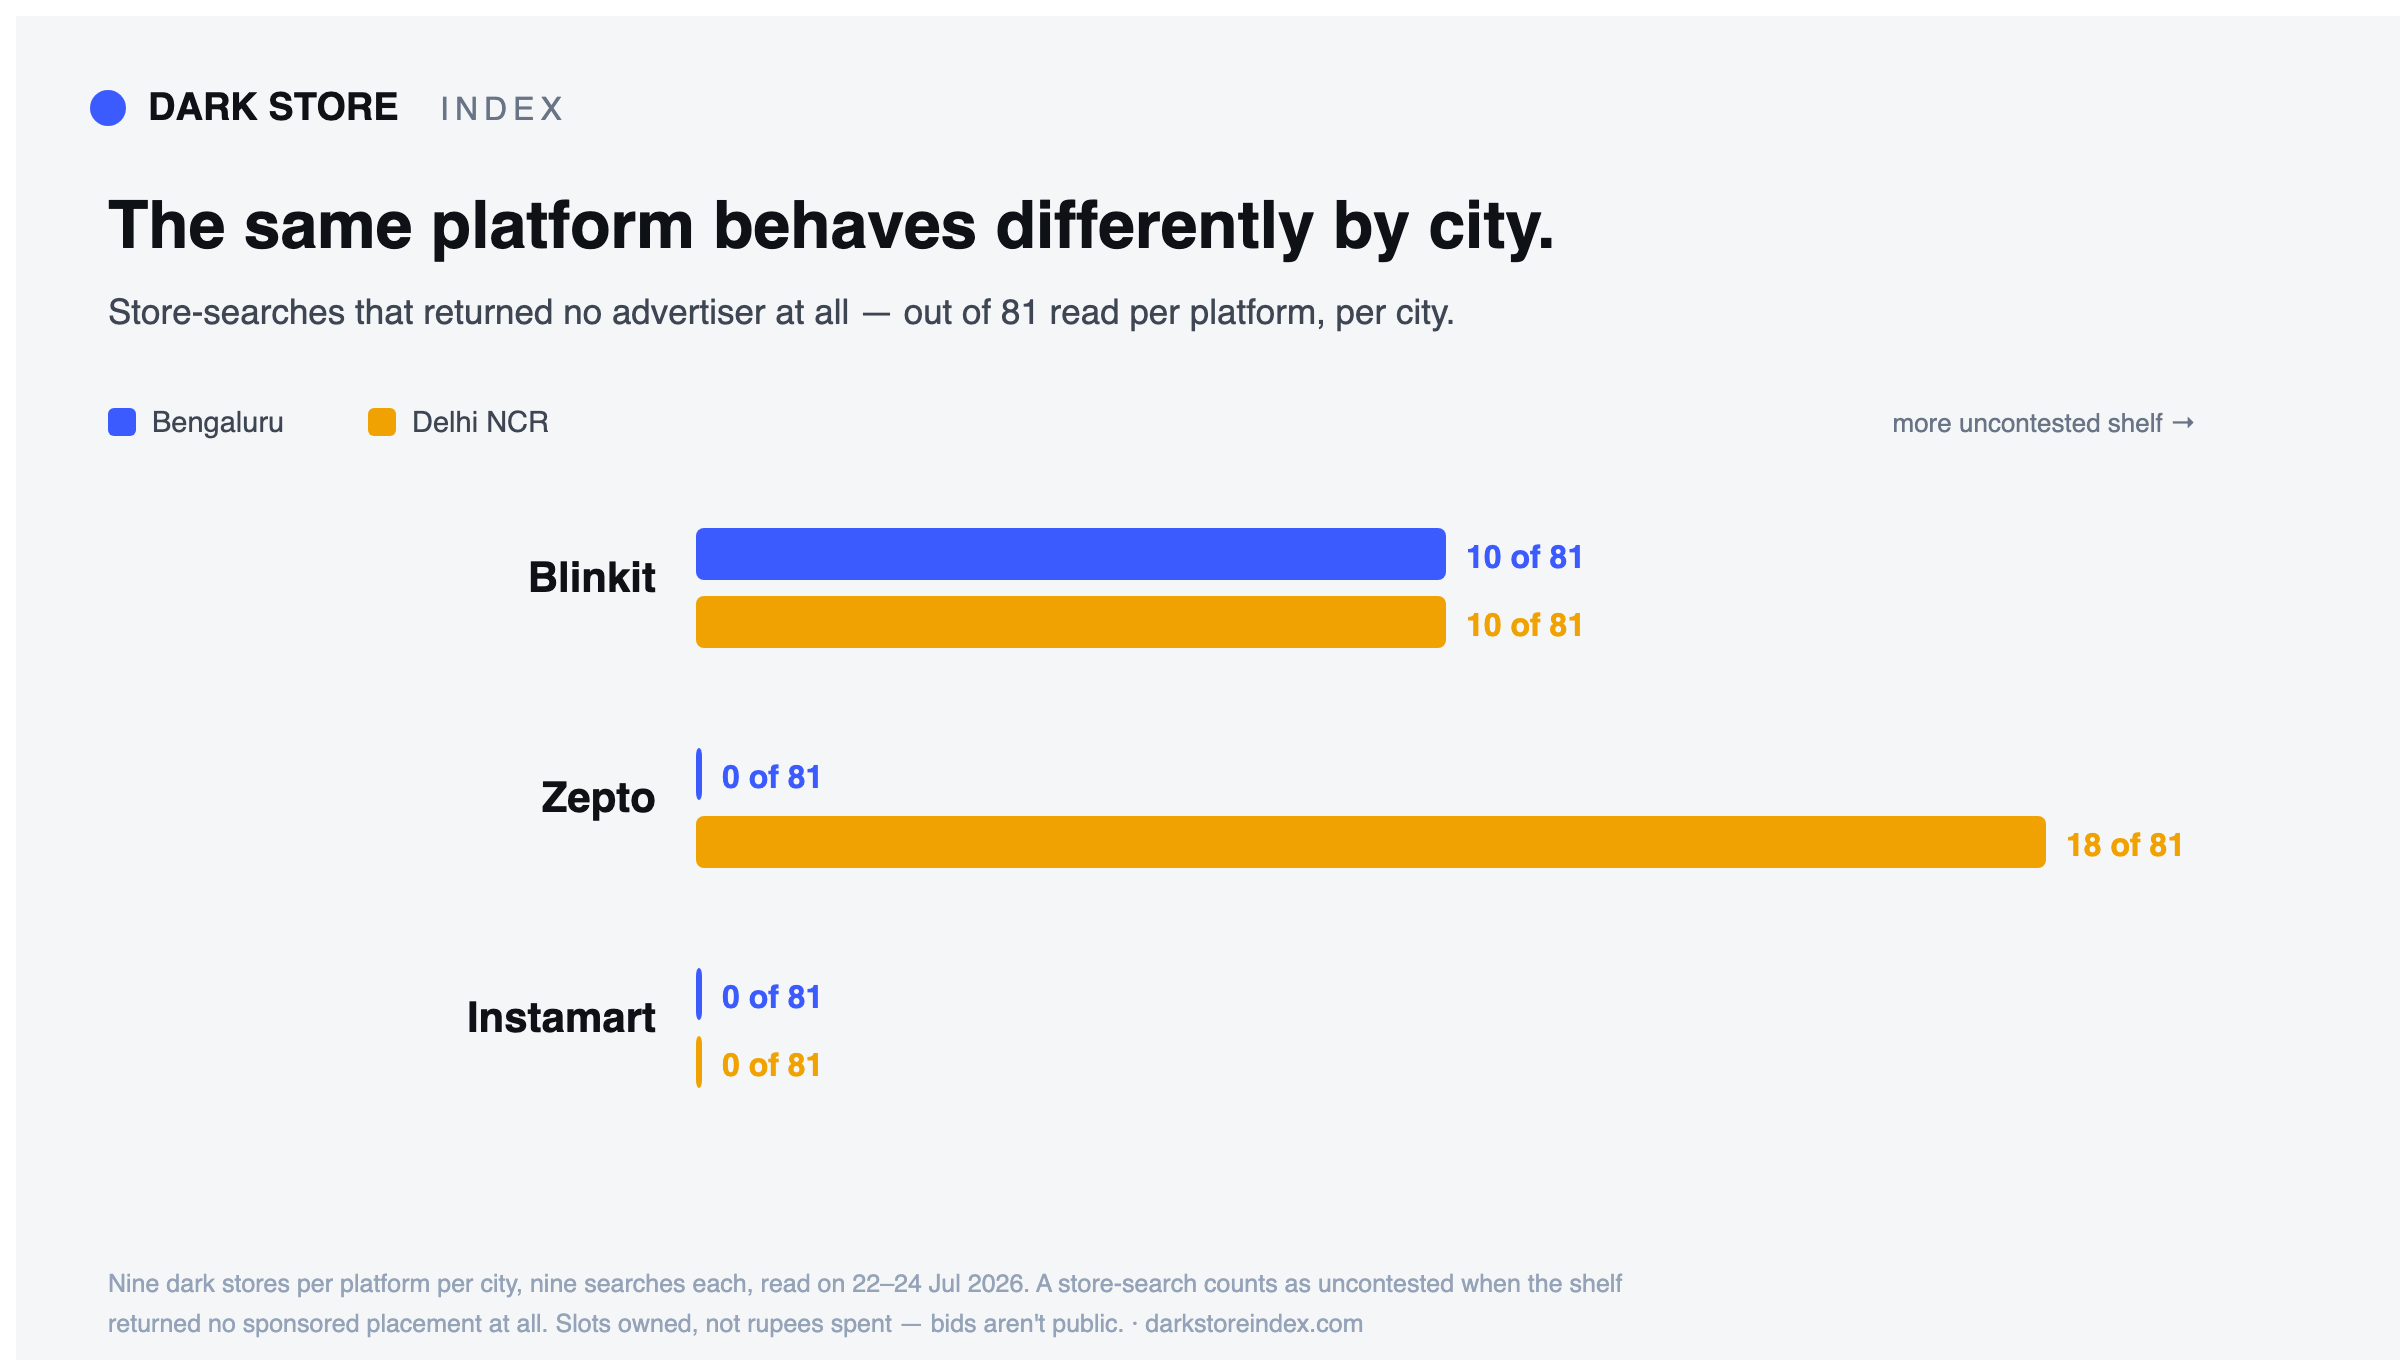
In July 2026 we read the same nine searches across nine dark stores per platform in Bengaluru and Delhi NCR — 486 store reads across Blinkit, Zepto and Swiggy Instamart. The three platforms did not behave alike, and one of them did not behave the same way in both cities. The full read is here: State of the Quick-Commerce Shelf — including the claim a second city broke, which we wrote up in full.
| Blinkit | Zepto | Instamart | |
|---|---|---|---|
| Store-searches with no advertiser at all | 10 of 81 | 0 of 81 | 0 of 81 |
| Distinct brands per search (average) | 19 | 10 | 21 |
| Top advertiser's share of a category's paid slots | 31–100% | 21–70% | 29–90% |
Blinkit is the only one of the three where uncontested shelf still exists. In Bengaluru, every Zepto and Instamart store we read had a sponsored placement for every search. That held for Instamart in Delhi NCR too — but not for Zepto, where 18 of 81 store-searches had no advertiser. See why the finding broke in a second city. On Blinkit, 10 of 81 store-searches had no advertiser at all.
Ad ownership is also far more concentrated than the market assumes. On Instamart, one brand held 240 sponsored placements for “protein bar” — 66% of everything paid in that category. On Zepto, one brand held 70% of every protein-bar ad. In Blinkit's granola-bar category, a single brand held every paid slot we counted while seven other well-known brands ran none.
Full write-ups: Blinkit vs Zepto: two completely different shelves and who's actually buying the Blinkit shelf.
Category shelf reports
Per-category reads with per-store tables, now covering all three platforms. Each report states its date, its city, and the stores it covers.
Coffee
Bru appeared in every store we read for “coffee powder” — while Continental held 47% of the category's paid slots.
Protein & energy bars
On Instamart, one brand held 240 sponsored placements — 66% of the whole category.
Baby care
Aveeno held 62% of Blinkit's baby-lotion ad slots — yet two stores had no advertiser at all.
Guides for brands selling on these platforms
Practical guides built on the measured data rather than restating platform documentation.
- Blinkit seller guide — registration, the panel, and what decides whether you sell once listed.
- Blinkit seller registration — documents, approval, and what registration does not get you.
- Blinkit seller login — where it is, and the blind spot on the other side of it.
- How to list products on Blinkit — why listed is not stocked, and stocked is not visible.
- Blinkit advertising — who already owns the sponsored slots in your category.
- Zepto seller guide — onboarding, the Seller Hub, and the shelf you're joining.
- Zepto seller registration — documents, and why Zepto has no free shelf space.
- Swiggy Instamart seller guide — the third platform, and the most crowded shelf.
- How to sell on Blinkit and Zepto — the registration walkthrough.
How we measure
The method is deliberately narrow, because a narrow claim that holds is worth more than a broad one that doesn't.
- Public shelf only. We read what a shopper sees when they search from a given location. No seller accounts, no platform partnerships, no brand's private data, nothing supplied by anyone.
- Per dark store, never averaged. Each read is tied to one store's catchment. National averages hide exactly the stores where a brand is invisible, so we don't produce them.
- Ads are counted as slots owned, never rupees spent. Bids are not public. Anyone quoting quick-commerce ad spend is estimating; we count placements, which is a fact.
- A failed read is never reported as an absence. If a store can't be read it is excluded, never recorded as “the brand isn't there.”
- Ranks are reported as a floor, not a position. Platforms cap how many results they return, so the lowest position we see for a brand is a limit of the read — not a claim about where it sits in the full catalogue. We don't publish rank-spread headlines for that reason.
- Depth is compared for consistency, not size. Because those caps differ by platform, raw result counts are not comparable between them. We compare how much a platform varies between its own stores.
- Stated limitations. One city on one day is a snapshot, not a trend, and we label it as such.
Who publishes this
The Dark Store Index is written and published by Gulshan Iyer, and produced by The Dark Store Index — a free tool that reads any brand's live quick-commerce shelf store by store. The data here comes from the same pipeline that powers the tool.
How we handle our own bias
We say it plainly because you should weigh it. The commercial interest is real — we would like brands to use the tool. What we won't do is let it shape a number.
That is why the method section above spends more words on this data's limits than on its strengths, and why findings that turned out to be measurement artefacts have been removed from this site rather than quietly left up.
No client's brand, private data or competitive set ever appears in these reports. Everything published here is category level and read from the public shelf.
Corrections and data requests: hello@darkstoreindex.com. If you're a journalist or analyst and want a category or city read that isn't published yet, ask — we'll run it and share the raw numbers.
Your brand isn't in these reports
These are category snapshots. To read your own brand's shelf in each dark store — rank, stock and which rival holds the sponsored slot above you — run it yourself. Free, no signup, nothing to connect. It works on any brand, including your competitors'.